
Changelog
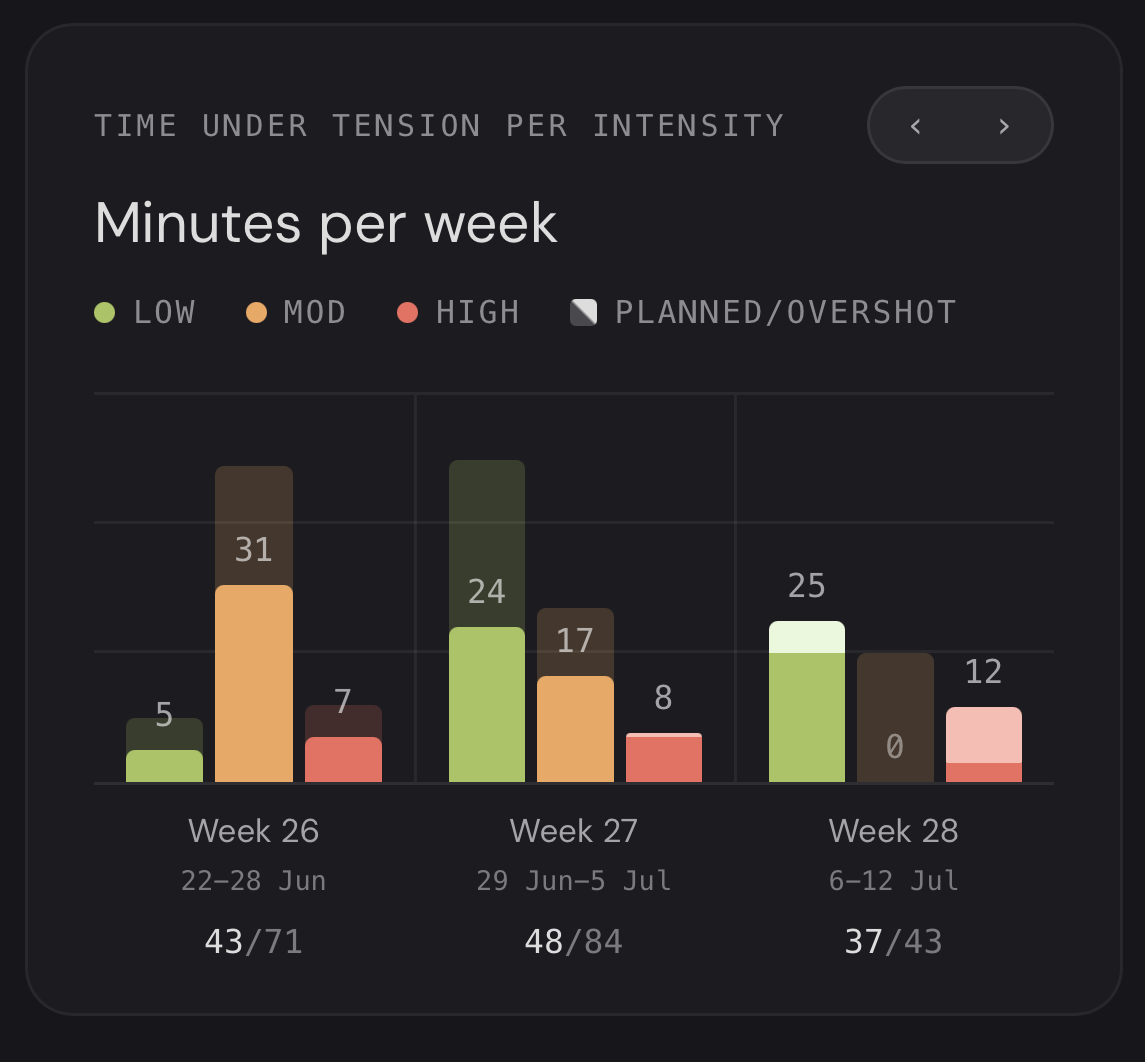
Time under tension per intensity
You can now track your weekly time under tension at low, moderate and high intensity under Analytics. Each week shows how much you trained against what was planned. Go between weeks with the arrows, and hover or tap a week to see all numbers.
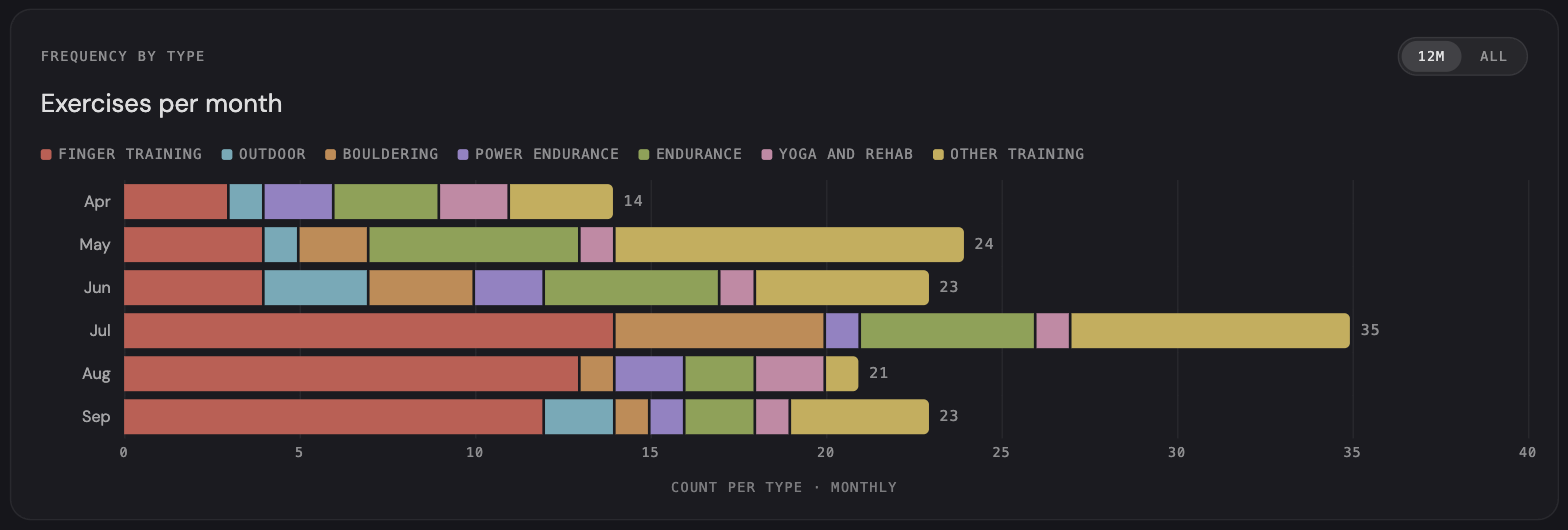
Exercises per type
You can now see how many exercises you’ve done of each type, month by month, under Analytics. Hover a bar to see exactly which exercises you logged.
Under Log you can now also see the actual results (hold times and weights) from exercises like max hangs.